不说话,装高手。
Maintain silence and pretend to be an experta
记录如何在uniapp小程序中使用echarts
介绍
这段时间项目很繁忙,遇到一个需求,需要在 uniapp 的微信小程序中使用图表。经过调研,uniapp 官方推荐跟他自己生态绑定的 UCharts,但是我在使用过程中真心难受,因为我们图表的需求个人认为较复杂,所以在开发途中踩了很多坑,下面我列举下我这段时间踩到的坑:
- UCharts 图表开启 X 轴滚动后,如果元素在 scrollview 中,会造成触摸不灵,在 ios 中的体验式触摸回弹(这个也是让我奔溃的原因,因为现场反馈用户体验感很差)
- UCharts 的 Mix 混合图只能支持柱状和折线两类图,当我需要实现堆叠柱状图 + 折线图时就无法使用 UCharts 实现
- 自由度不够,因为图表需求需要大量定制化,所以这里推荐仅仅只是简单展示的话,可以使用 UCharts ,如果需要定制化,建议使用 ECharts
- 社区原因, UCharts 有很多 bug 都没有在社区收录,但是他提供了很多个交流群,可惜都没什么人说话
上面的问题经过组内商量,决定使用 Echarts ,下面展开说说如何在 uniapp 的小程序中使用 ECharts
方案查找
确认要使用 ECharts 后我们就开始去查询各种方案:
- echarts-for-wx:这个是在 uniapp 插件市场找到的一个支持小程序使用 ECharts 的组件,看了下代码感觉有点老旧,所以放弃了
- echarts-for-weixin:这是 github 上找到的一个微信小程序原生组件,扫码看了下案例感觉还行,所以打算玩一下
准备
定制化 ECharts
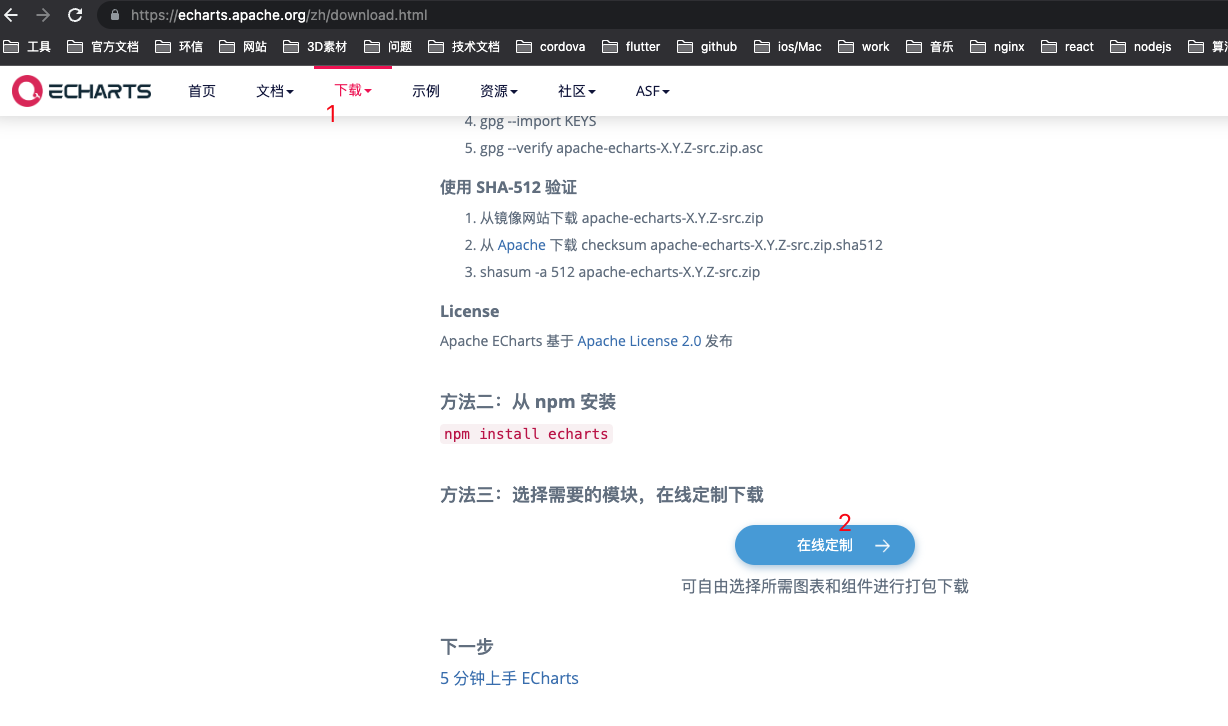
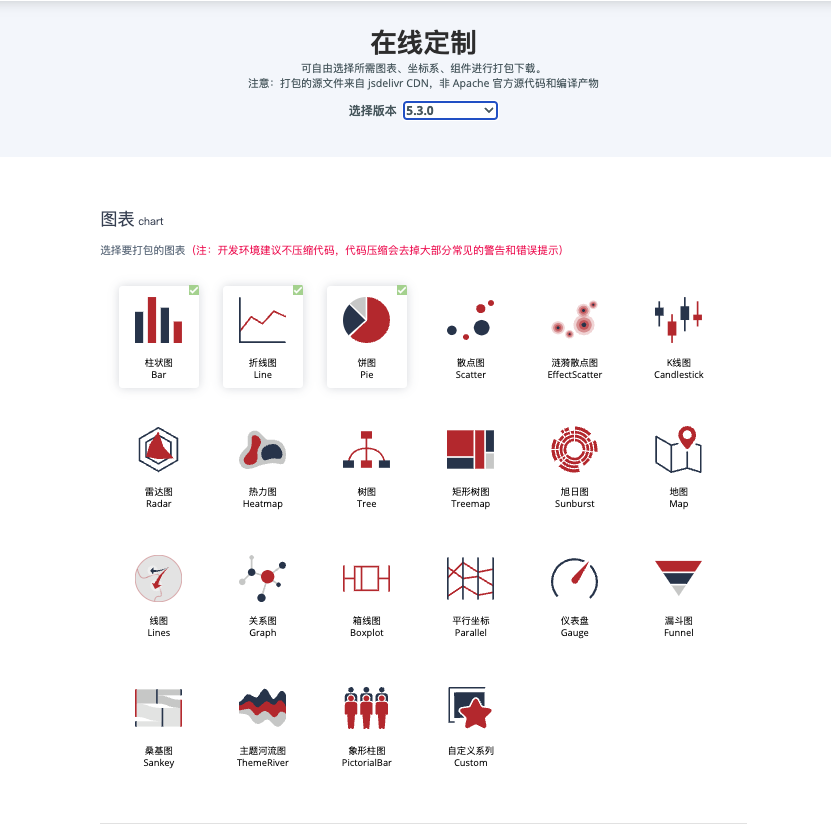
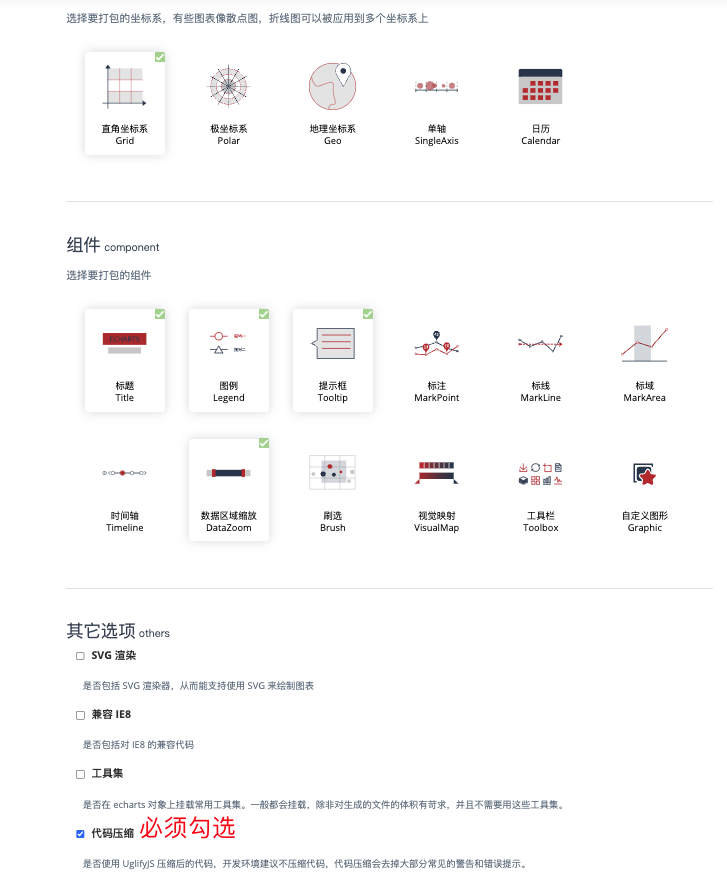
因为微信小程序对项目体积有严格限制,所以我们的 ECharts 文件不能太大,只下载我们用到的即可,抛弃一些无用工具,下面请看流程,这是我的一些配置:
进入 ECharts 官网
clone echarts-for-weixin 并修改 ec-canvas 组件
去 github 克隆这个项目,把里面的 ec-canvas 组件拷贝出来,放在 uniapp 小程序项目中的自定义目录 wxcomponents 中,并将上一步下载下来的 echarts.min.js 文件放到 ec-canvas 目录里面,打开 ec-canvas.js ,修改里面的 ECharts 的引用
// import * as echarts from './echarts';
import * as echarts from './echarts.min.js';
修改配置文件,全局引入原生组件
"globalStyle": {
  "usingComponents":{
    "ec-canvas":"/wxcomponents/ec-canvas/ec-canvas"
  },
},
重新编译一下项目
使用组件
<template>
  <view class="container">
    <ec-canvas id="mychart-dom-bar" canvas-id="mychart-bar" :ec="{ ec: { onInit: initChart } }"></ec-canvas>
  </view>
</template>

export default {
  name: 'pageName',
  methods: {
    initChart(canvas, width, height, dpr) {
      const chart = echarts.init(canvas, null, {
        width: width,
        height: height,
        devicePixelRatio: dpr
      });
      canvas.setChart(chart);

      var option = {
        xAxis: {
          type: 'category',
          data: ['Mon', 'Tue', 'Wed', 'Thu', 'Fri', 'Sat', 'Sun']
        },
        yAxis: {
          type: 'value'
        },
        series: [
          {
            data: [150, 230, 224, 218, 135, 147, 260],
            type: 'line'
          }
        ]
      };
      chart.setOption(option);
      return chart;
    }
  }
}
这样即可展示 ECharts 图表
问题
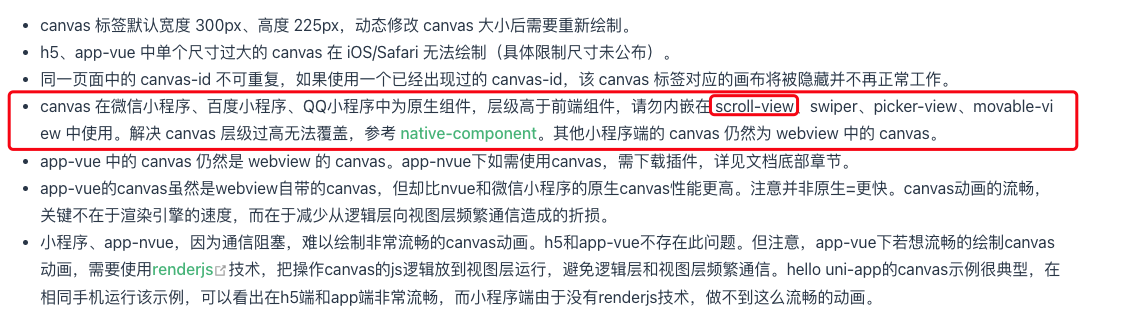
我在使用中发现了一个问题,这个问题在模拟器中没有体现,在 android 设备中也没有体现,仅仅只是在 ios设备中出现,因为我在使用组件时把组件嵌套在 scrollview 中,会导致组件下半部分触摸不到,就好像有一半容器被遮挡,能看见但是点击触摸不到,但是通过真机调试 debug 又查找不出来问题
经过多次调试发现给原生组件 canvas 绑定 touch 事件并将原生组件嵌套在 scrollview 组件中,就会出现上述问题
所以我们需要改造组件,既然不能将 touch 事件绑定在 canvas 上,那么是否可以将事件绑定在上层的 view 元素中
改造组件
修改 ec-canvas.wxml
<view
  style="width: 100%; height: 100%"
  bindtouchstart="{{ ec.disableTouch ? '' : 'touchStart' }}"
  bindtouchmove="{{ec.disableTouch ? '' : 'touchMove' }}"
  bindtouchend="{{ ec.disableTouch ? '' : 'touchEnd' }}"
>
  <!-- 新的:接口对其了H5 -->
  <canvas wx:if="{{isUseNewCanvas}}" type="2d" class="ec-canvas" canvas-id="{{ canvasId }}" bindinit="init"></canvas>
  <!-- 旧的 -->
  <canvas wx:else class="ec-canvas" canvas-id="{{ canvasId }}" bindinit="init"></canvas>
</view>
修改 ec-canvas.js ,找到 3个 touch 函数,修改如下:
touchStart(e) {
  if (this.chart && e.touches.length > 0) {
    // 查找canvas元素并计算判断当前触摸范围是否在canvas元素内
    const query = uni.createSelectorQuery().in(this)
    query.select('.ec-canvas').boundingClientRect(data => {
        const touch = e.touches[0];
        const x = touch.clientX - data.left;
        const y = touch.clientY - data.top;
        if (x >= 0 && x <= data.width && y >= 0 && y <= data.height) {
          const handler = this.chart.getZr().handler;
          handler.dispatch('mousedown', {
            zrX: x,
            zrY: y,
            preventDefault: () => {},
            stopImmediatePropagation: () => {},
            stopPropagation: () => {}
          });
          handler.dispatch('mousemove', {
            zrX: x,
            zrY: y,
            preventDefault: () => {},
            stopImmediatePropagation: () => {},
            stopPropagation: () => {}
          });
          handler.processGesture(wrapTouch(e), 'start');
        }
      }).exec();
  }
},
touchMove(e) {
  if (this.chart && e.touches.length > 0) {
    // 查找canvas元素并计算判断当前触摸范围是否在canvas元素内
    const query = uni.createSelectorQuery().in(this)
    query.select('.ec-canvas').boundingClientRect(data => {
        const touch = e.touches[0];
        const x = touch.clientX - data.left;
        const y = touch.clientY - data.top;
        if (x >= 0 && x <= data.width && y >= 0 && y <= data.height) {
          const handler = this.chart.getZr().handler;
          handler.dispatch('mousemove', {
            zrX: x,
            zrY: y,
            preventDefault: () => {},
            stopImmediatePropagation: () => {},
            stopPropagation: () => {}
          });
          handler.processGesture(this.wrapTouch(e), 'change');
        }
      }).exec();
  }
},
touchEnd(e) {
  if (this.chart) {
    // 查找canvas元素并计算判断当前触摸范围是否在canvas元素内
    const query = uni.createSelectorQuery().in(this)
    query.select('.ec-canvas').boundingClientRect(data => {
      const touch = e.changedTouches ? e.changedTouches[0] : {};
      const x = touch.clientX - data.left;
      const y = touch.clientY - data.top;
      if (x >= 0 && x <= data.width && y >= 0 && y <= data.height) {
        const handler = this.chart.getZr().handler;
        handler.dispatch('mouseup', {
          zrX: x,
          zrY: y,
          preventDefault: () => {},
          stopImmediatePropagation: () => {},
          stopPropagation: () => {}
        });
        handler.dispatch('click', {
          zrX: x,
          zrY: y,
          preventDefault: () => {},
          stopImmediatePropagation: () => {},
          stopPropagation: () => {}
        });
        handler.processGesture(this.wrapTouch(e), 'end');
      }
    }).exec();
  }
},
重新编译文件,可以看到图表在 scrollview 也能正常交互,并且我个人感觉交互比 UCharts 流畅,下面这是前后对比图: