不说话,装高手。
Maintain silence and pretend to be an experta
Echarts实现一个下钻伪3d地图
最近在大屏可视化项目中有个展示地图的功能,要求:
- 好看排第一
- 支持钻入钻出
- 能单独展示省份、地市,因为客户数据有的是省级,有的是市级
得到这个需求后第一个想到的就是Echarts,所以打开Echarts官方案例查看,找到一个类似的地图 demo
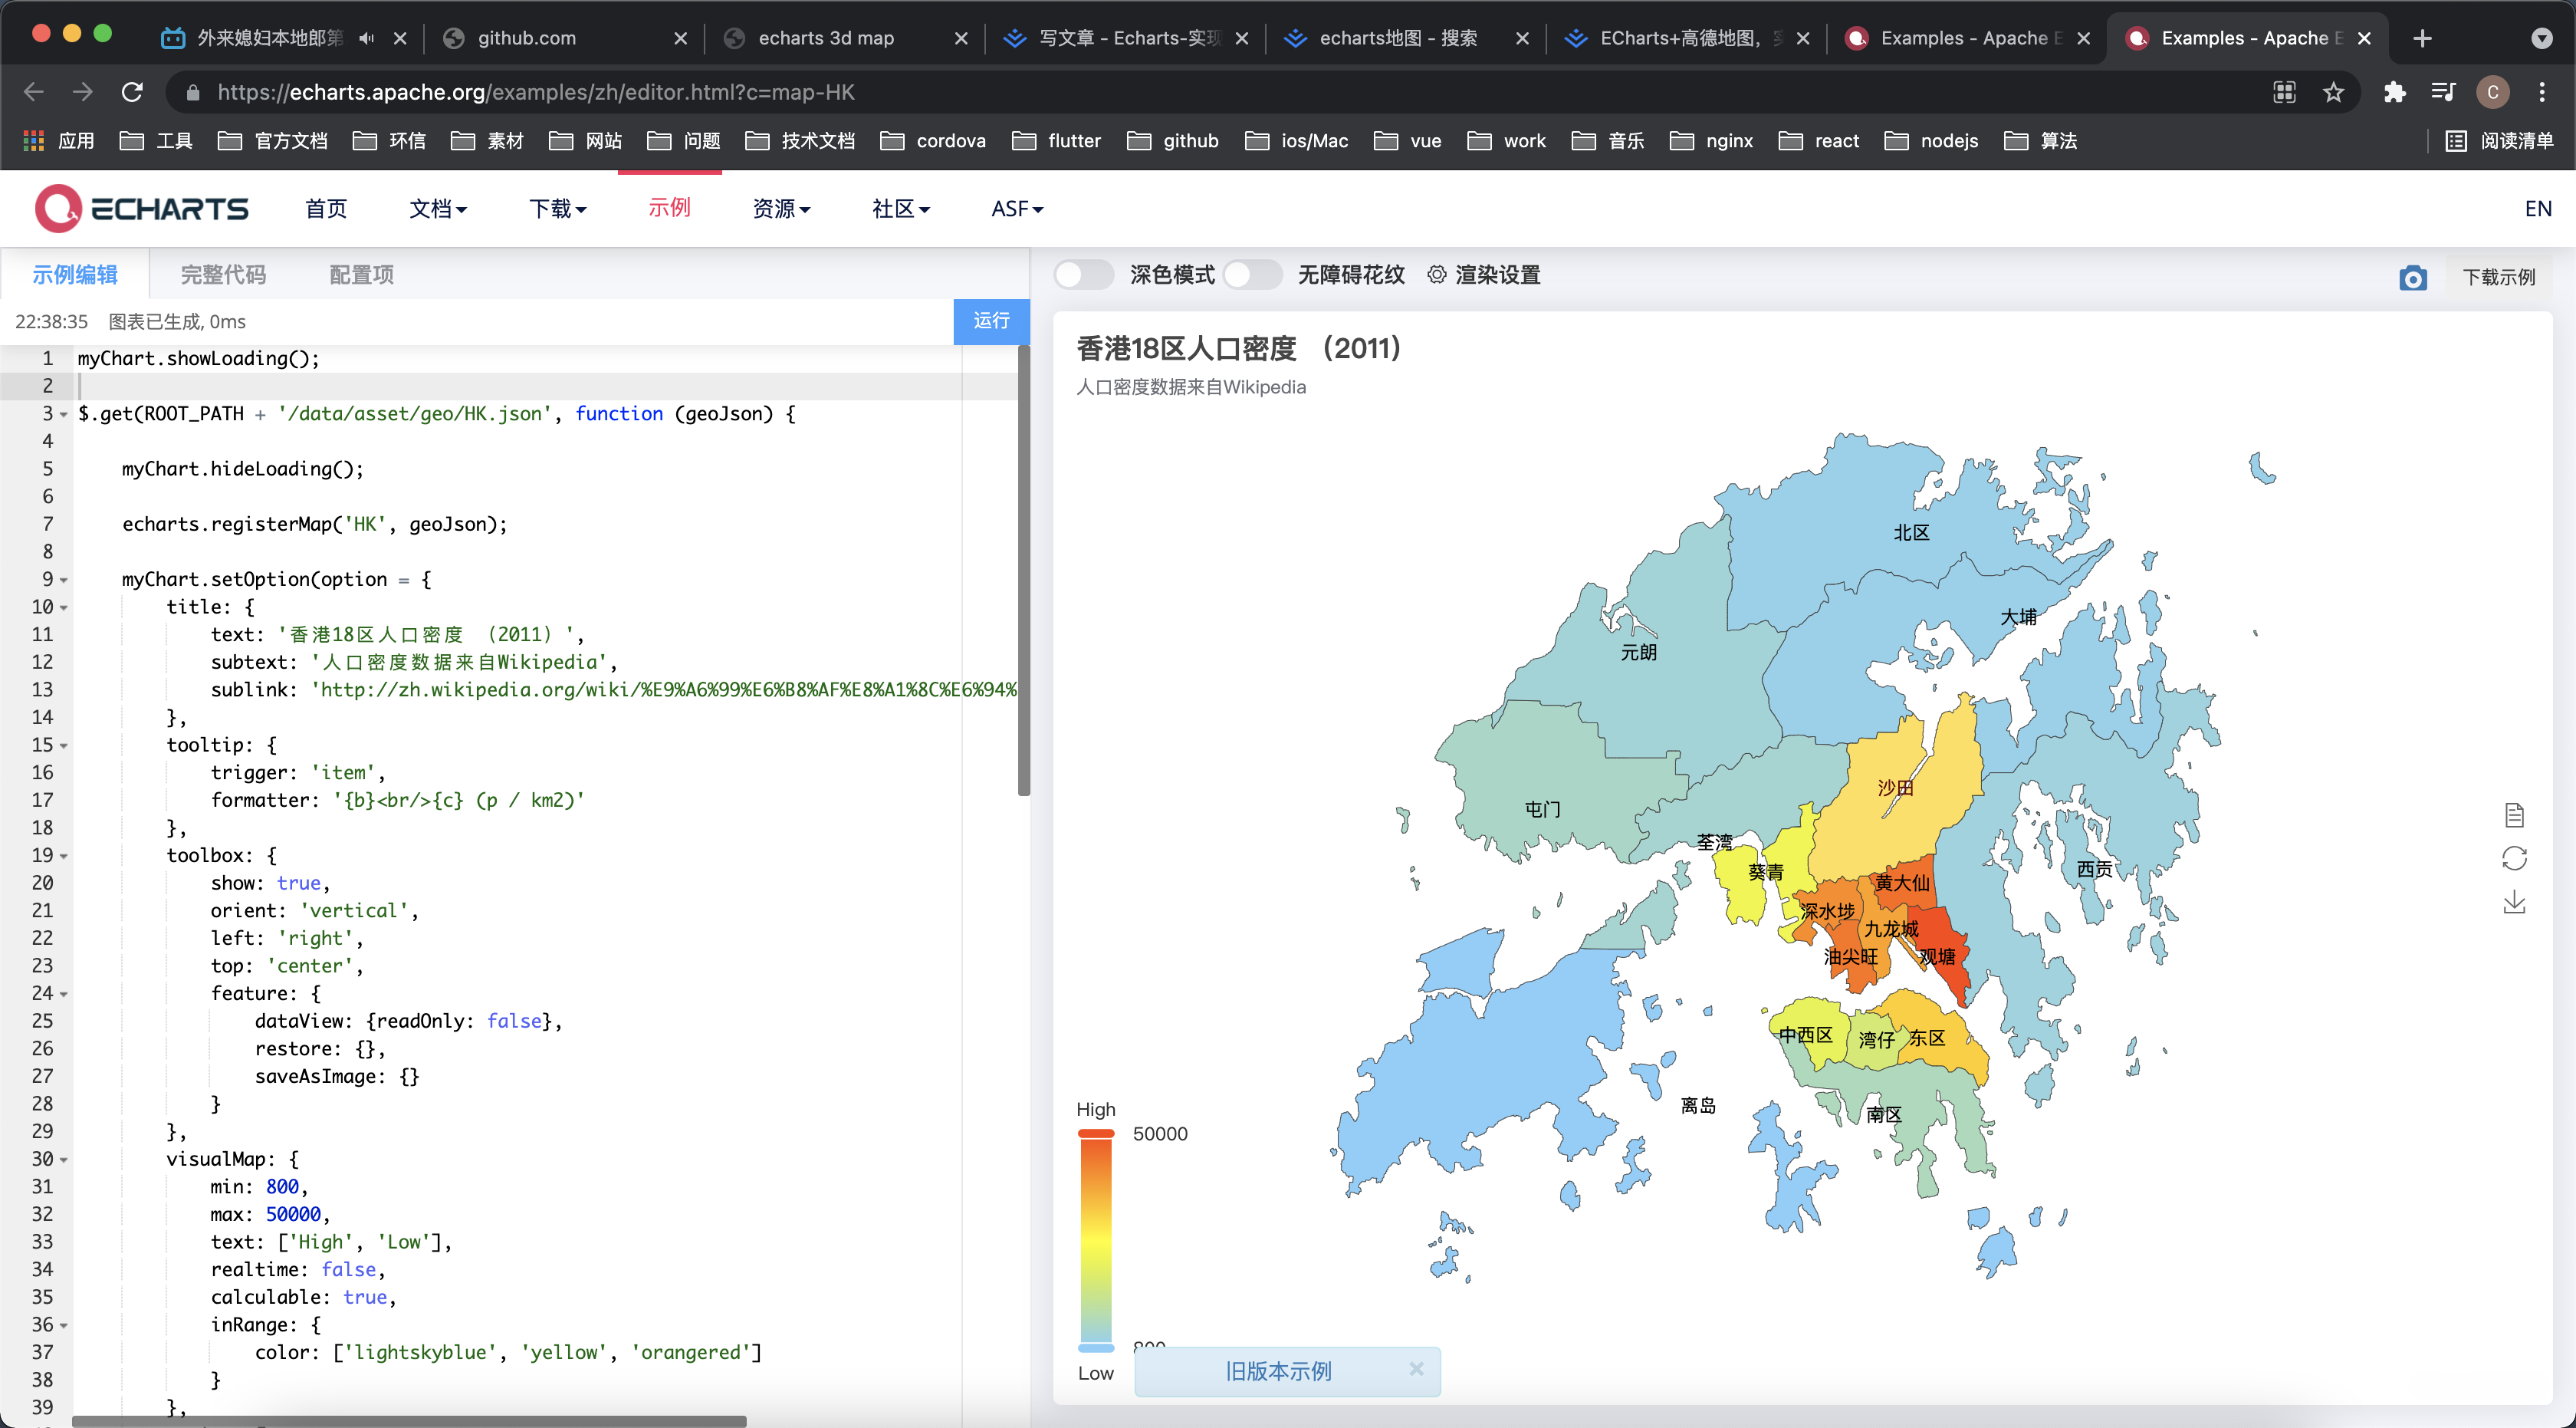
查看完整代码看到他是请求一个路径获取数据,反问了下路径看到他是一串带坐标的json数据
https://cdn.jsdelivr.net/gh/apache/echarts-website@asf-site/examples/data/asset/geo/HK.json
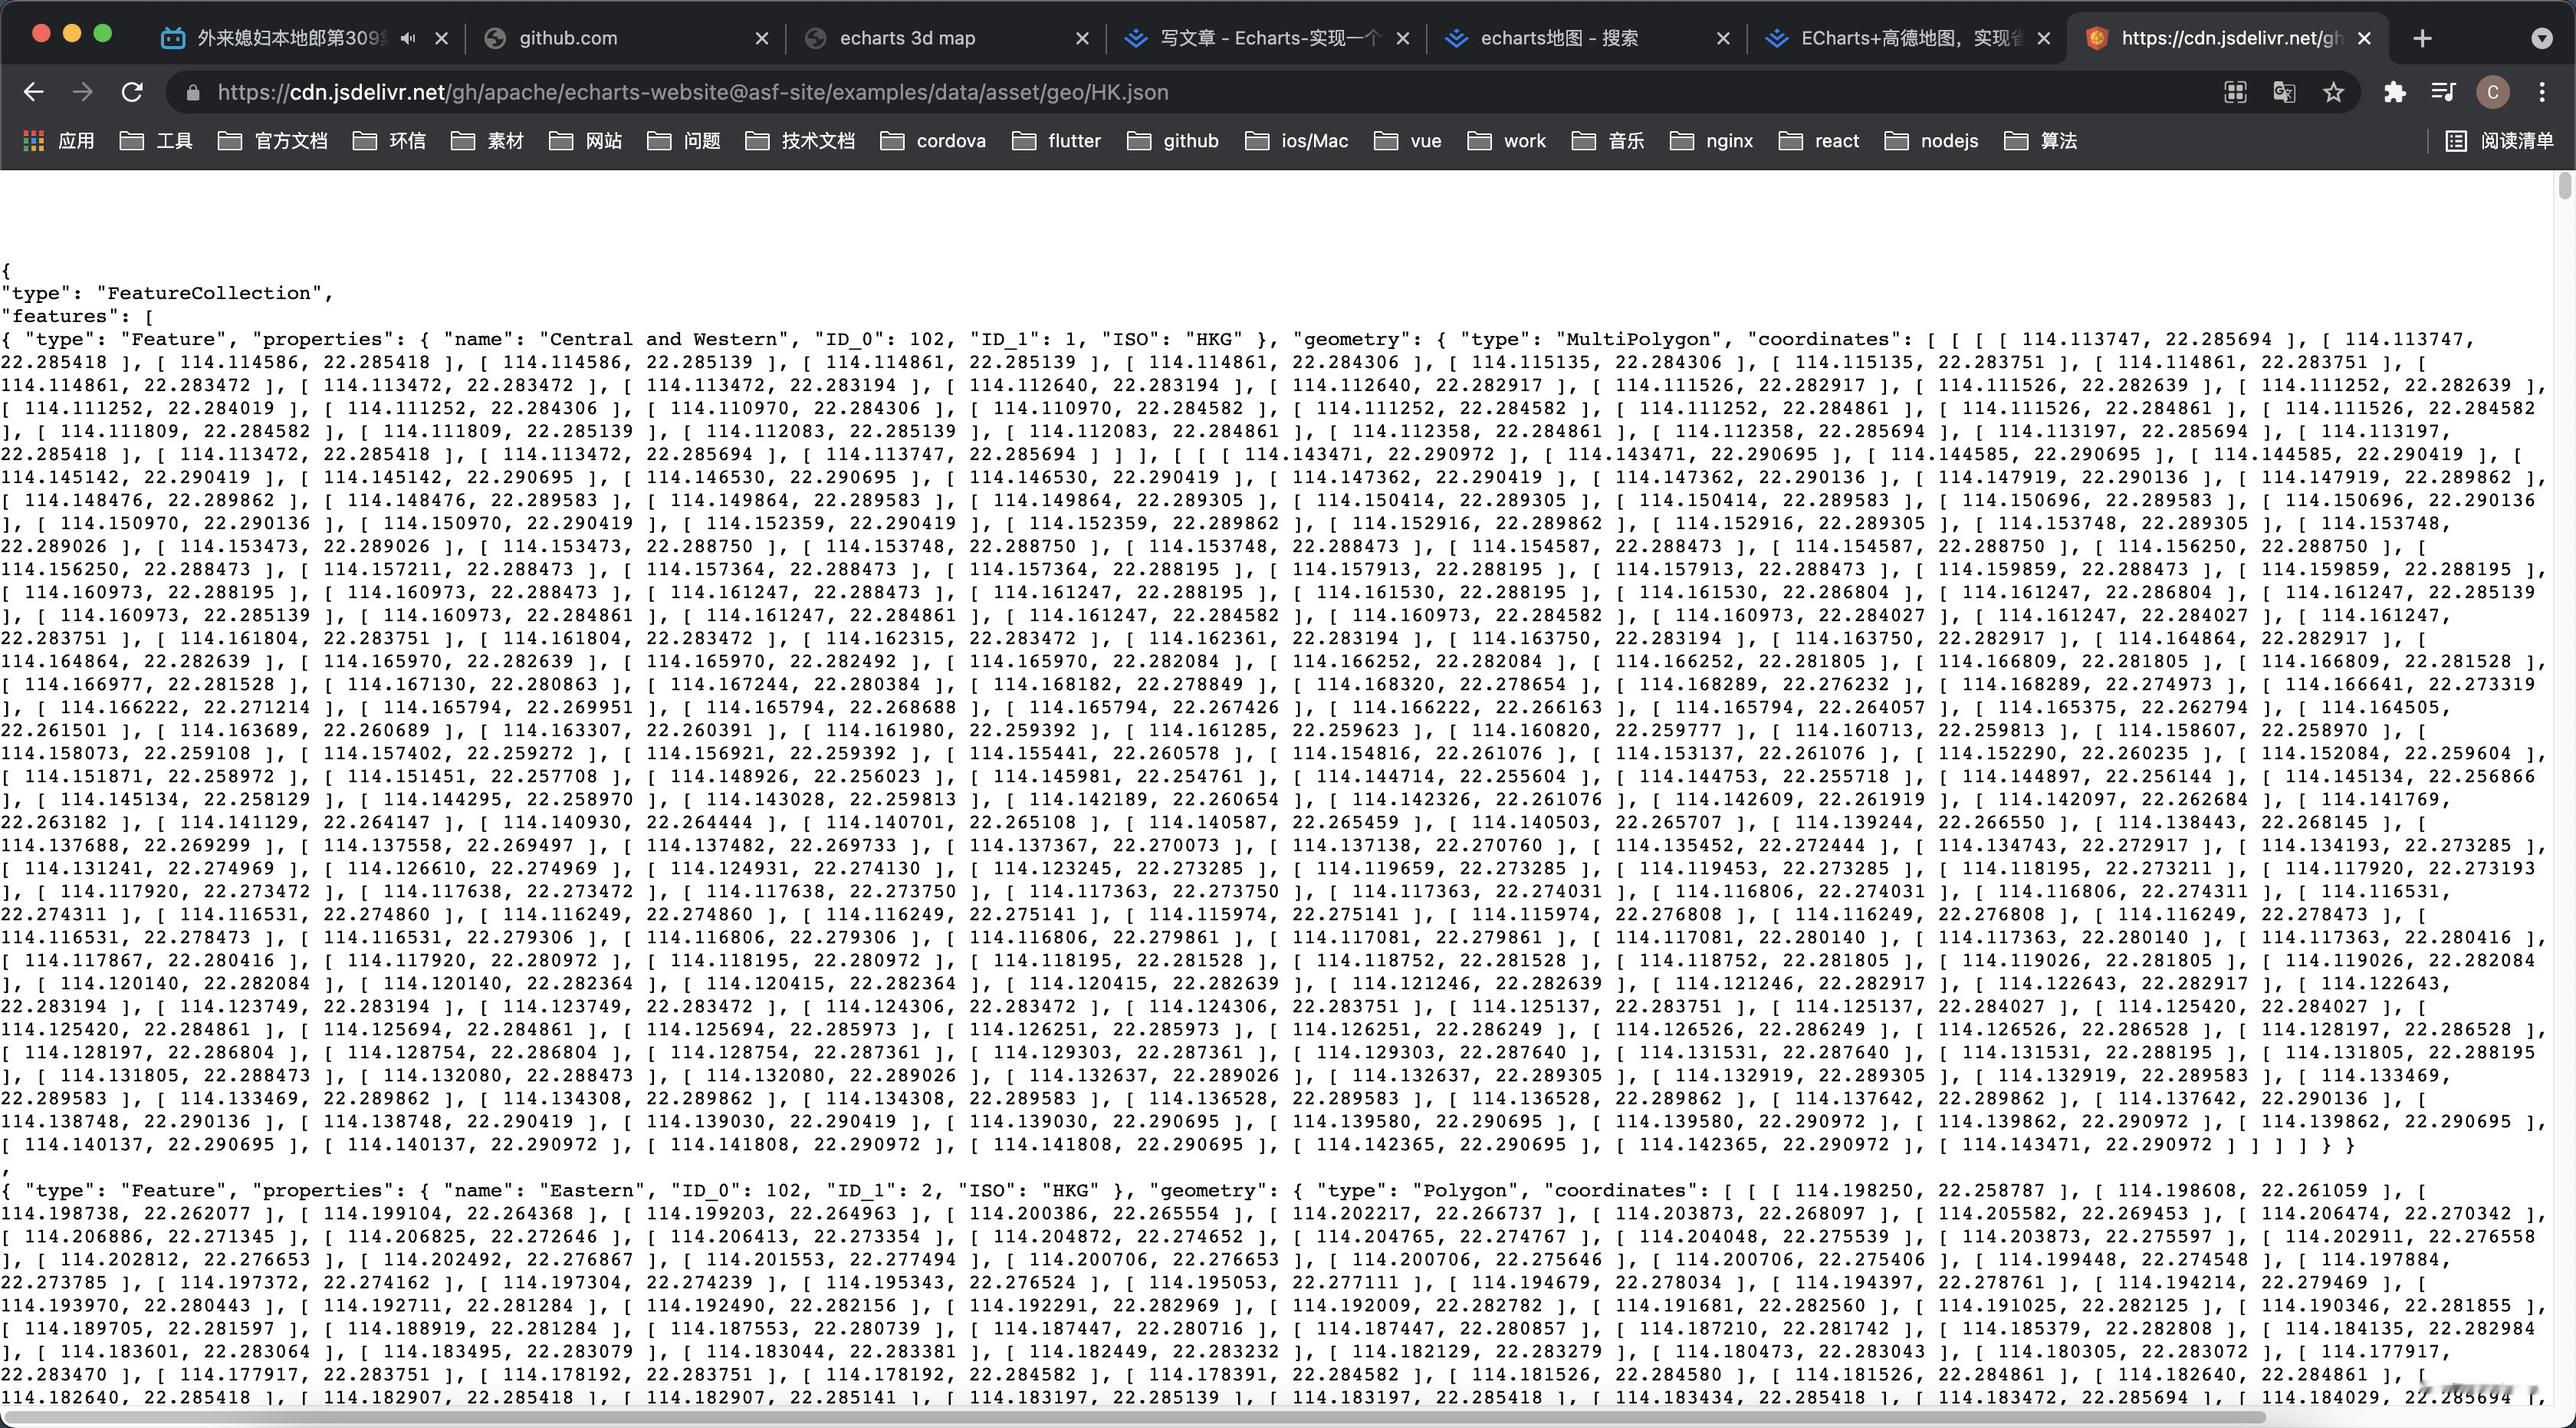
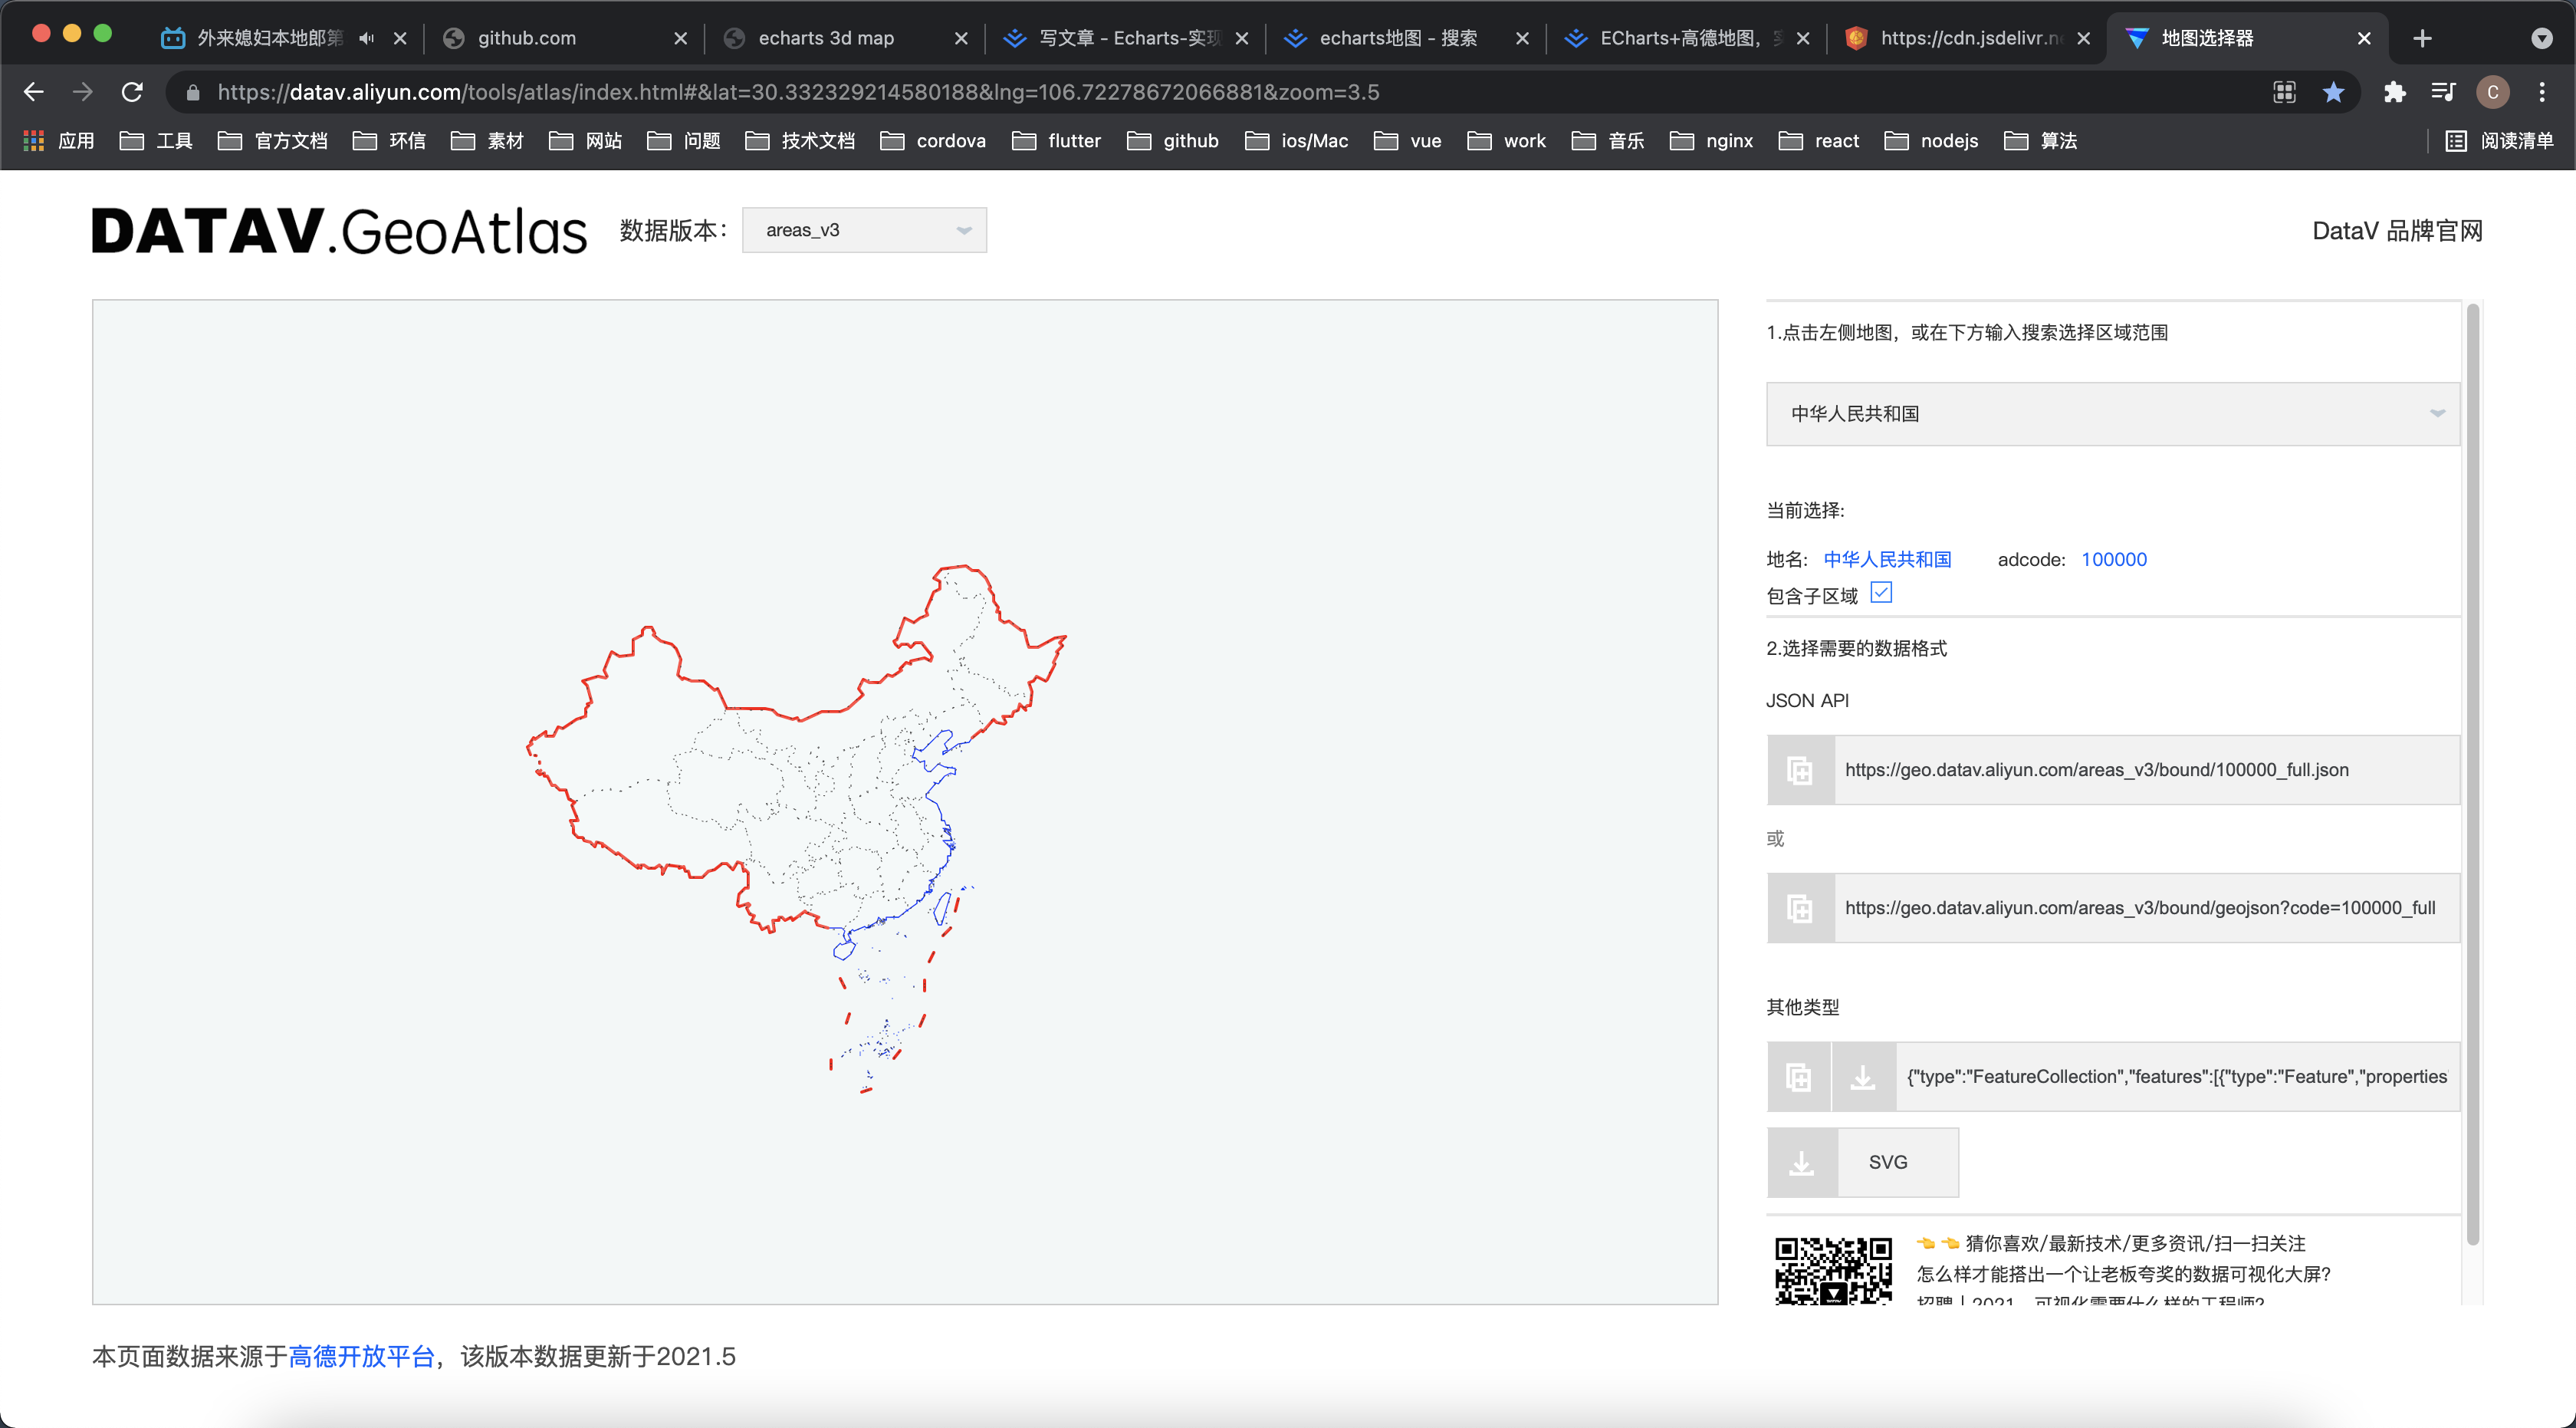
到这一步我涉及到知识盲区了,于是百度了下geoJson,发现阿里云dataV提供一个网站能获取geoJson数据
https://datav.aliyun.com/tools/atlas/index.html#&lat=30.332329214580188&lng=106.72278672066881&zoom=3.5
按照demo教程,尝试实现:
1. 先布局一下并引入所需文件
<!DOCTYPE html>
<html lang="en">
  <head>
    <meta charset="UTF-8" />
    <meta http-equiv="X-UA-Compatible" content="IE=edge" />
    <meta name="viewport" content="width=device-width, initial-scale=1.0" />
    <title>echarts 3d map</title>
    <style>
      * {
        margin: 0;
        padding: 0;
      }

      .echarts-map {
        position: fixed;
        top: 0;
        left: 0;
        width: 100vw;
        height: 100vh;
        background: url("./background.png") no-repeat;
      }
    </style>
  </head>

  <body>
    <div class="echarts-map" id="3dMap"></div>
  </body>

  <script src="https://cdn.bootcdn.net/ajax/libs/jquery/3.6.0/jquery.min.js"></script>
  <script src="https://cdn.bootcdn.net/ajax/libs/echarts/5.1.2/echarts.min.js"></script>
</html>

2. 地图渲染
let mapEcharts = null;

if (mapEcharts) {
    mapEcharts.dispose(); // 销毁实例,实例销毁后无法再被使用。
}

// 初始化图表
mapEcharts = echarts.init(document.getElementById("3dMap"));

// 数据请求
// 加载效果
mapEcharts.showLoading();

$.getJSON('https://geo.datav.aliyun.com/areas_v3/bound/100000_full.json', jsonData => {
    // 注册地图
    echarts.registerMap('china', jsonData);

    // 配置
    let options = {
        series: [
            {
                name: "map",
                type: "map", // 地图
                map: 'china', // 加载注册的地图
            },
        ],
    };

    mapEcharts.setOption(options); // 实例配置项与数据

    // 隐藏loading
    mapEcharts.hideLoading();
})

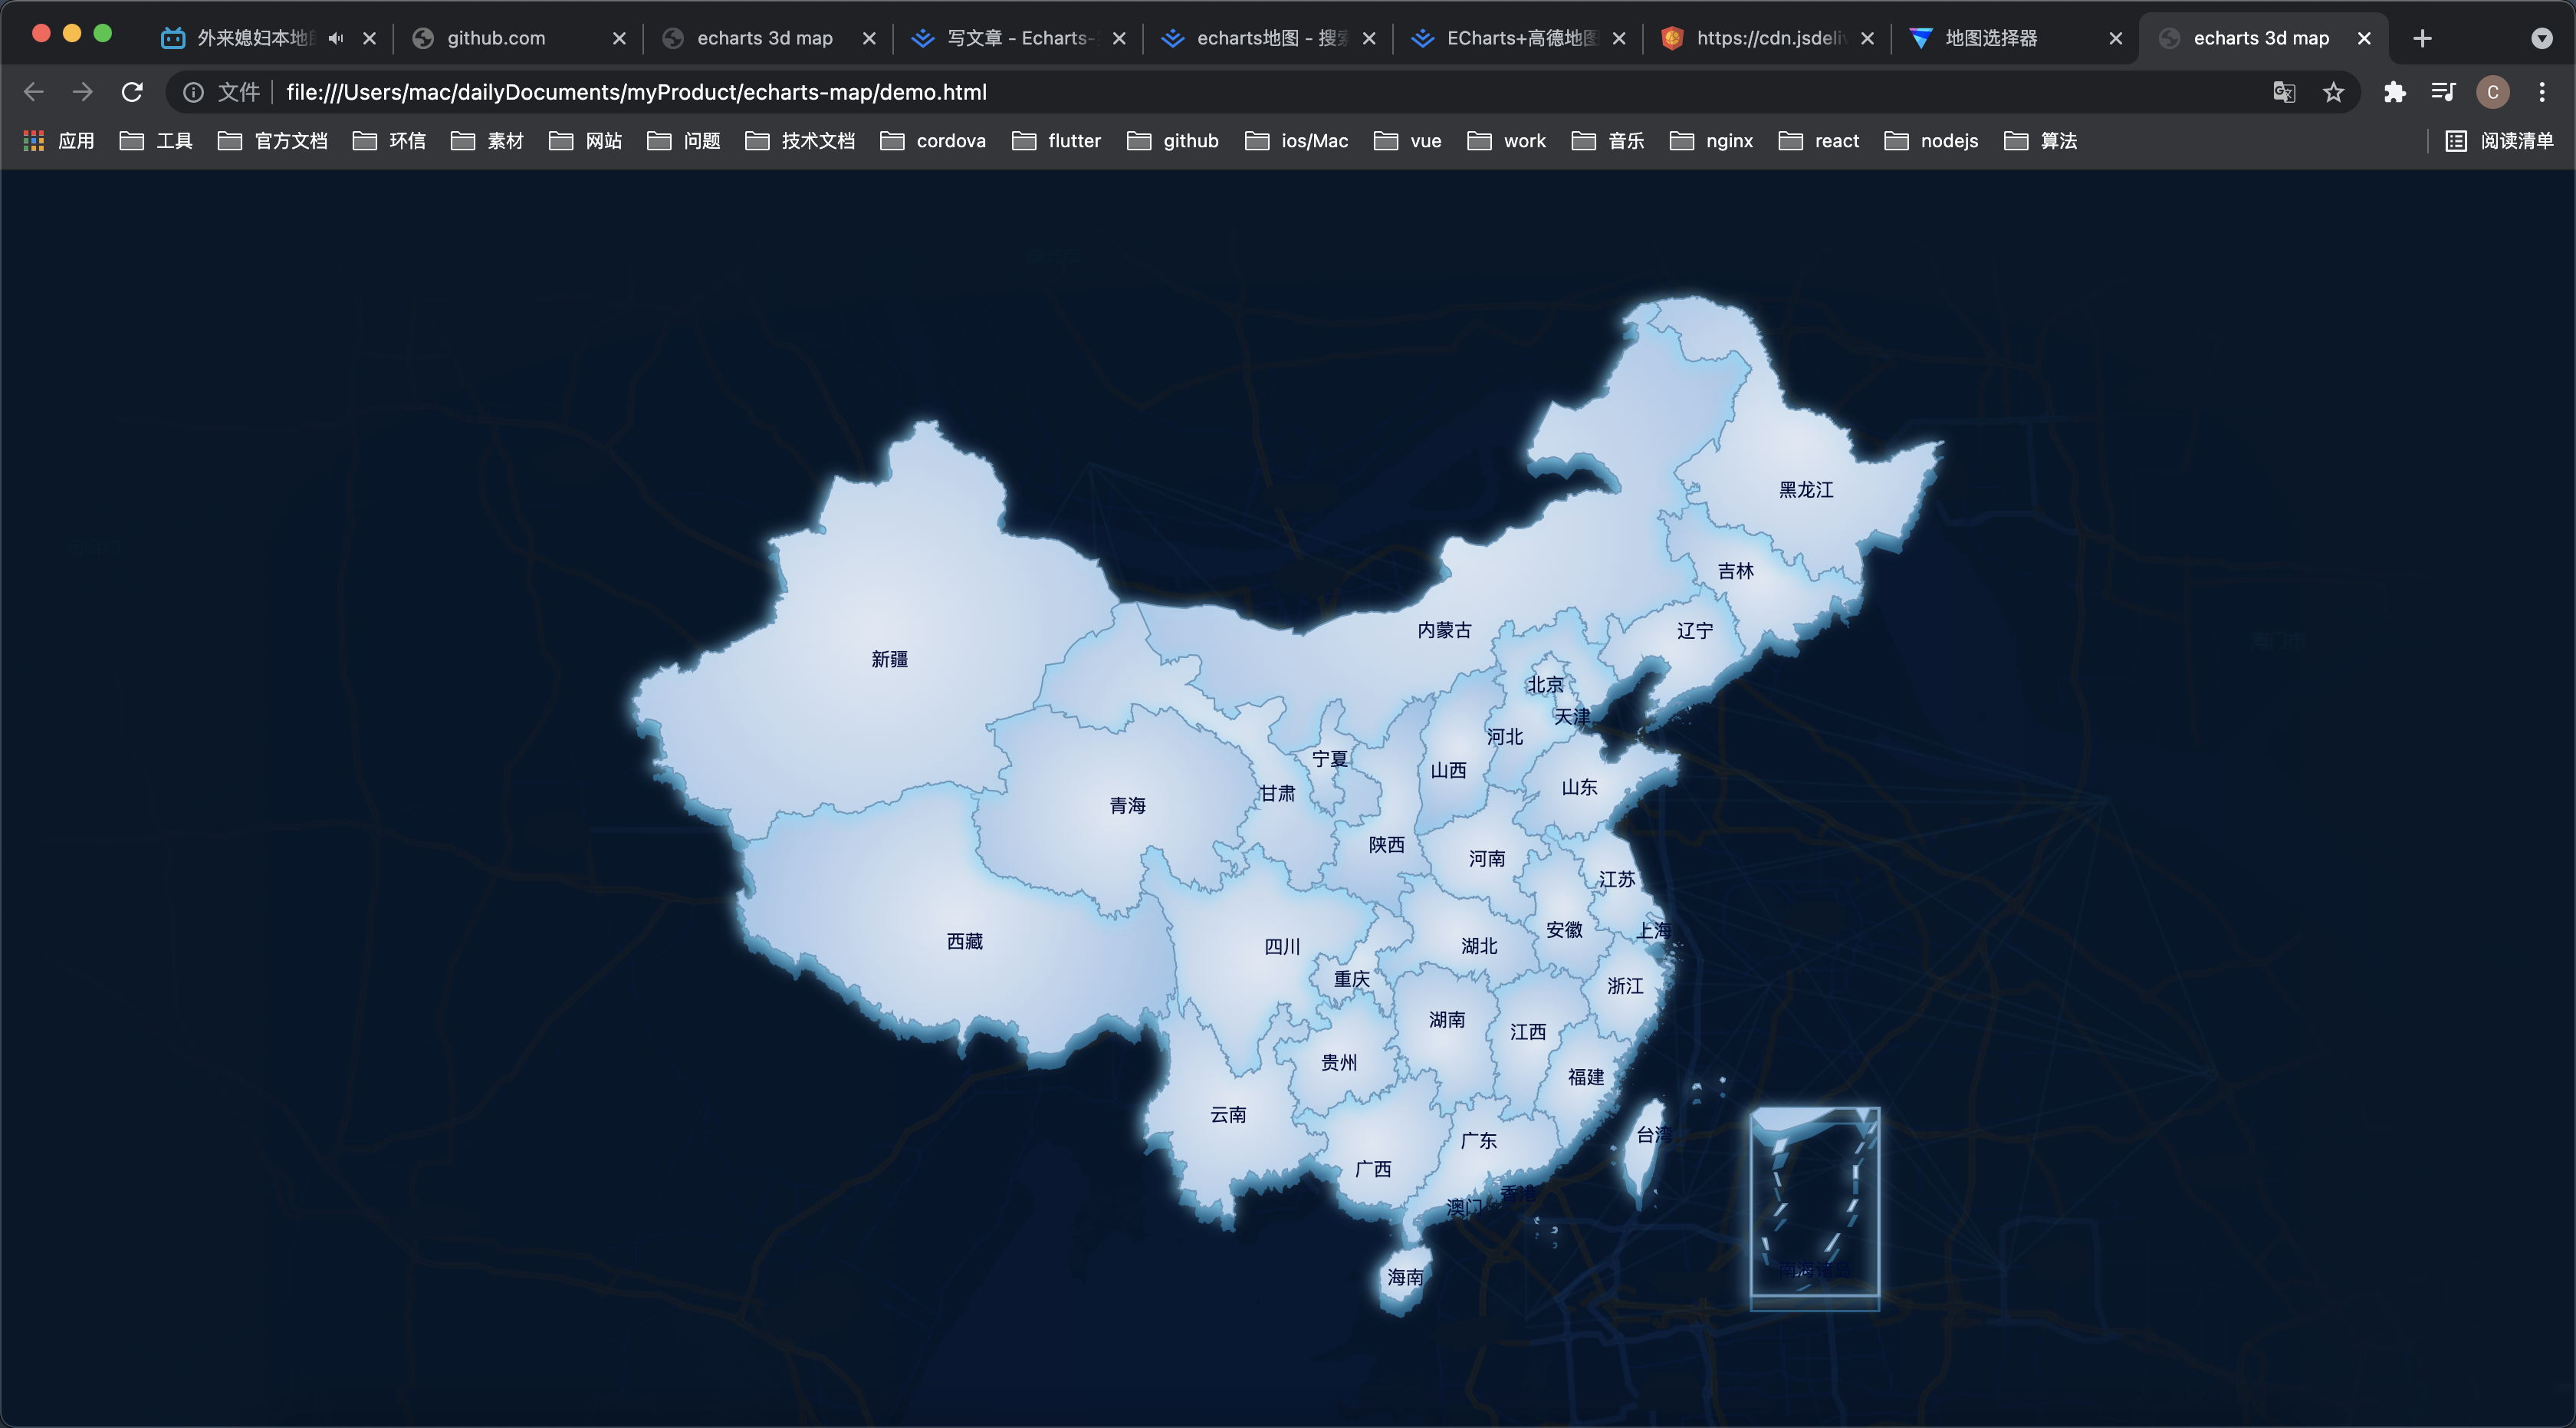
这里可以看到,地图基本已经出来了,接下来就是美化地图,在地图上能看到海南诸岛的数据,但是实际上海南诸岛的数据已经在右下角,所以我整理了一份数据china.js放在本地,各位大佬可以在demo中自行获取。
3. 美化地图
添加地图渐变颜色以及选中颜色
let options = {
    series: [
      {
        name: "map",
        type: "map", // 地图
        map: mapName, // 加载注册的地图
        selectedMode: false, // 不让单独选中
        roam: true, // 开始鼠标事件,scale缩放、move移动
        // 图形上的文本标签
        label: {
          show: true,
          color: "#000a3c",
        },
        // 地图样式
        itemStyle: {
          // 区域样式
          areaColor: {
            type: "radial",
            x: 0.5,
            y: 0.5,
            r: 3,
            colorStops: [
              {
                offset: 0,
                color: "rgba(223, 231, 242, 1)", // 0% 处的颜色
              },
              {
                offset: 1,
                color: "rgba(2, 99, 206, 1)", // 100% 处的颜色
              },
            ],
            globalCoord: false, // 缺省为 false
          },
          borderWidth: 1, // 边框大小
          borderColor: "rgba(104, 152, 190, 1)", // 边框样式
          shadowColor: "rgba(128, 217, 248, 1)", // 阴影颜色
          shadowOffsetX: -2, // 阴影水平方向上的偏移距离
          shadowOffsetY: 2, // 阴影垂直方向上的偏移距离
          shadowBlur: 10, // 文字块的背景阴影长度
        },
        // 选中状态下样式
        emphasis: {
          label: {
            color: "#ffffff",
          },
          itemStyle: {
            areaColor: "#a5d4fe",
          },
        },
      },
    ],
};

4. 制作伪3d效果
let options = {
    geo: {
      map: mapName, //地图类型。
      zoom: 1,
      roam: true,
      animation: false,
      itemStyle: {
        // 区域样式
        areaColor: {
          type: "radial",
          x: 0.5,
          y: 0.5,
          r: 0.8,
          colorStops: [
            {
              offset: 0,
              color: "rgba(147, 235, 248, 1)", // 0% 处的颜色
            },
            {
              offset: 1,
              color: "rgba(2, 99, 206, 1)", // 100% 处的颜色
            },
          ],
          globalCoord: false, // 缺省为 false
        },
        shadowColor: "#105781", //地图区域的阴影颜色。
        shadowOffsetX: 0,
        shadowOffsetY: 10,
      },
    },
    series: [
      {
        name: "map",
        type: "map", // 地图
        map: mapName, // 加载注册的地图
        selectedMode: false, // 不让单独选中
        roam: true, // 开始鼠标事件,scale缩放、move移动
        // 图形上的文本标签
        label: {
          show: true,
          color: "#000a3c",
        },
        // 地图样式
        itemStyle: {
          // 区域样式
          areaColor: {
            type: "radial",
            x: 0.5,
            y: 0.5,
            r: 3,
            colorStops: [
              {
                offset: 0,
                color: "rgba(223, 231, 242, 1)", // 0% 处的颜色
              },
              {
                offset: 1,
                color: "rgba(2, 99, 206, 1)", // 100% 处的颜色
              },
            ],
            globalCoord: false, // 缺省为 false
          },
          borderWidth: 1, // 边框大小
          borderColor: "rgba(104, 152, 190, 1)", // 边框样式
          shadowColor: "rgba(128, 217, 248, 1)", // 阴影颜色
          shadowOffsetX: -2, // 阴影水平方向上的偏移距离
          shadowOffsetY: 2, // 阴影垂直方向上的偏移距离
          shadowBlur: 10, // 文字块的背景阴影长度
        },
        // 选中状态下样式
        emphasis: {
          label: {
            color: "#ffffff",
          },
          itemStyle: {
            areaColor: "#a5d4fe",
          },
        },
      },
    ],
};
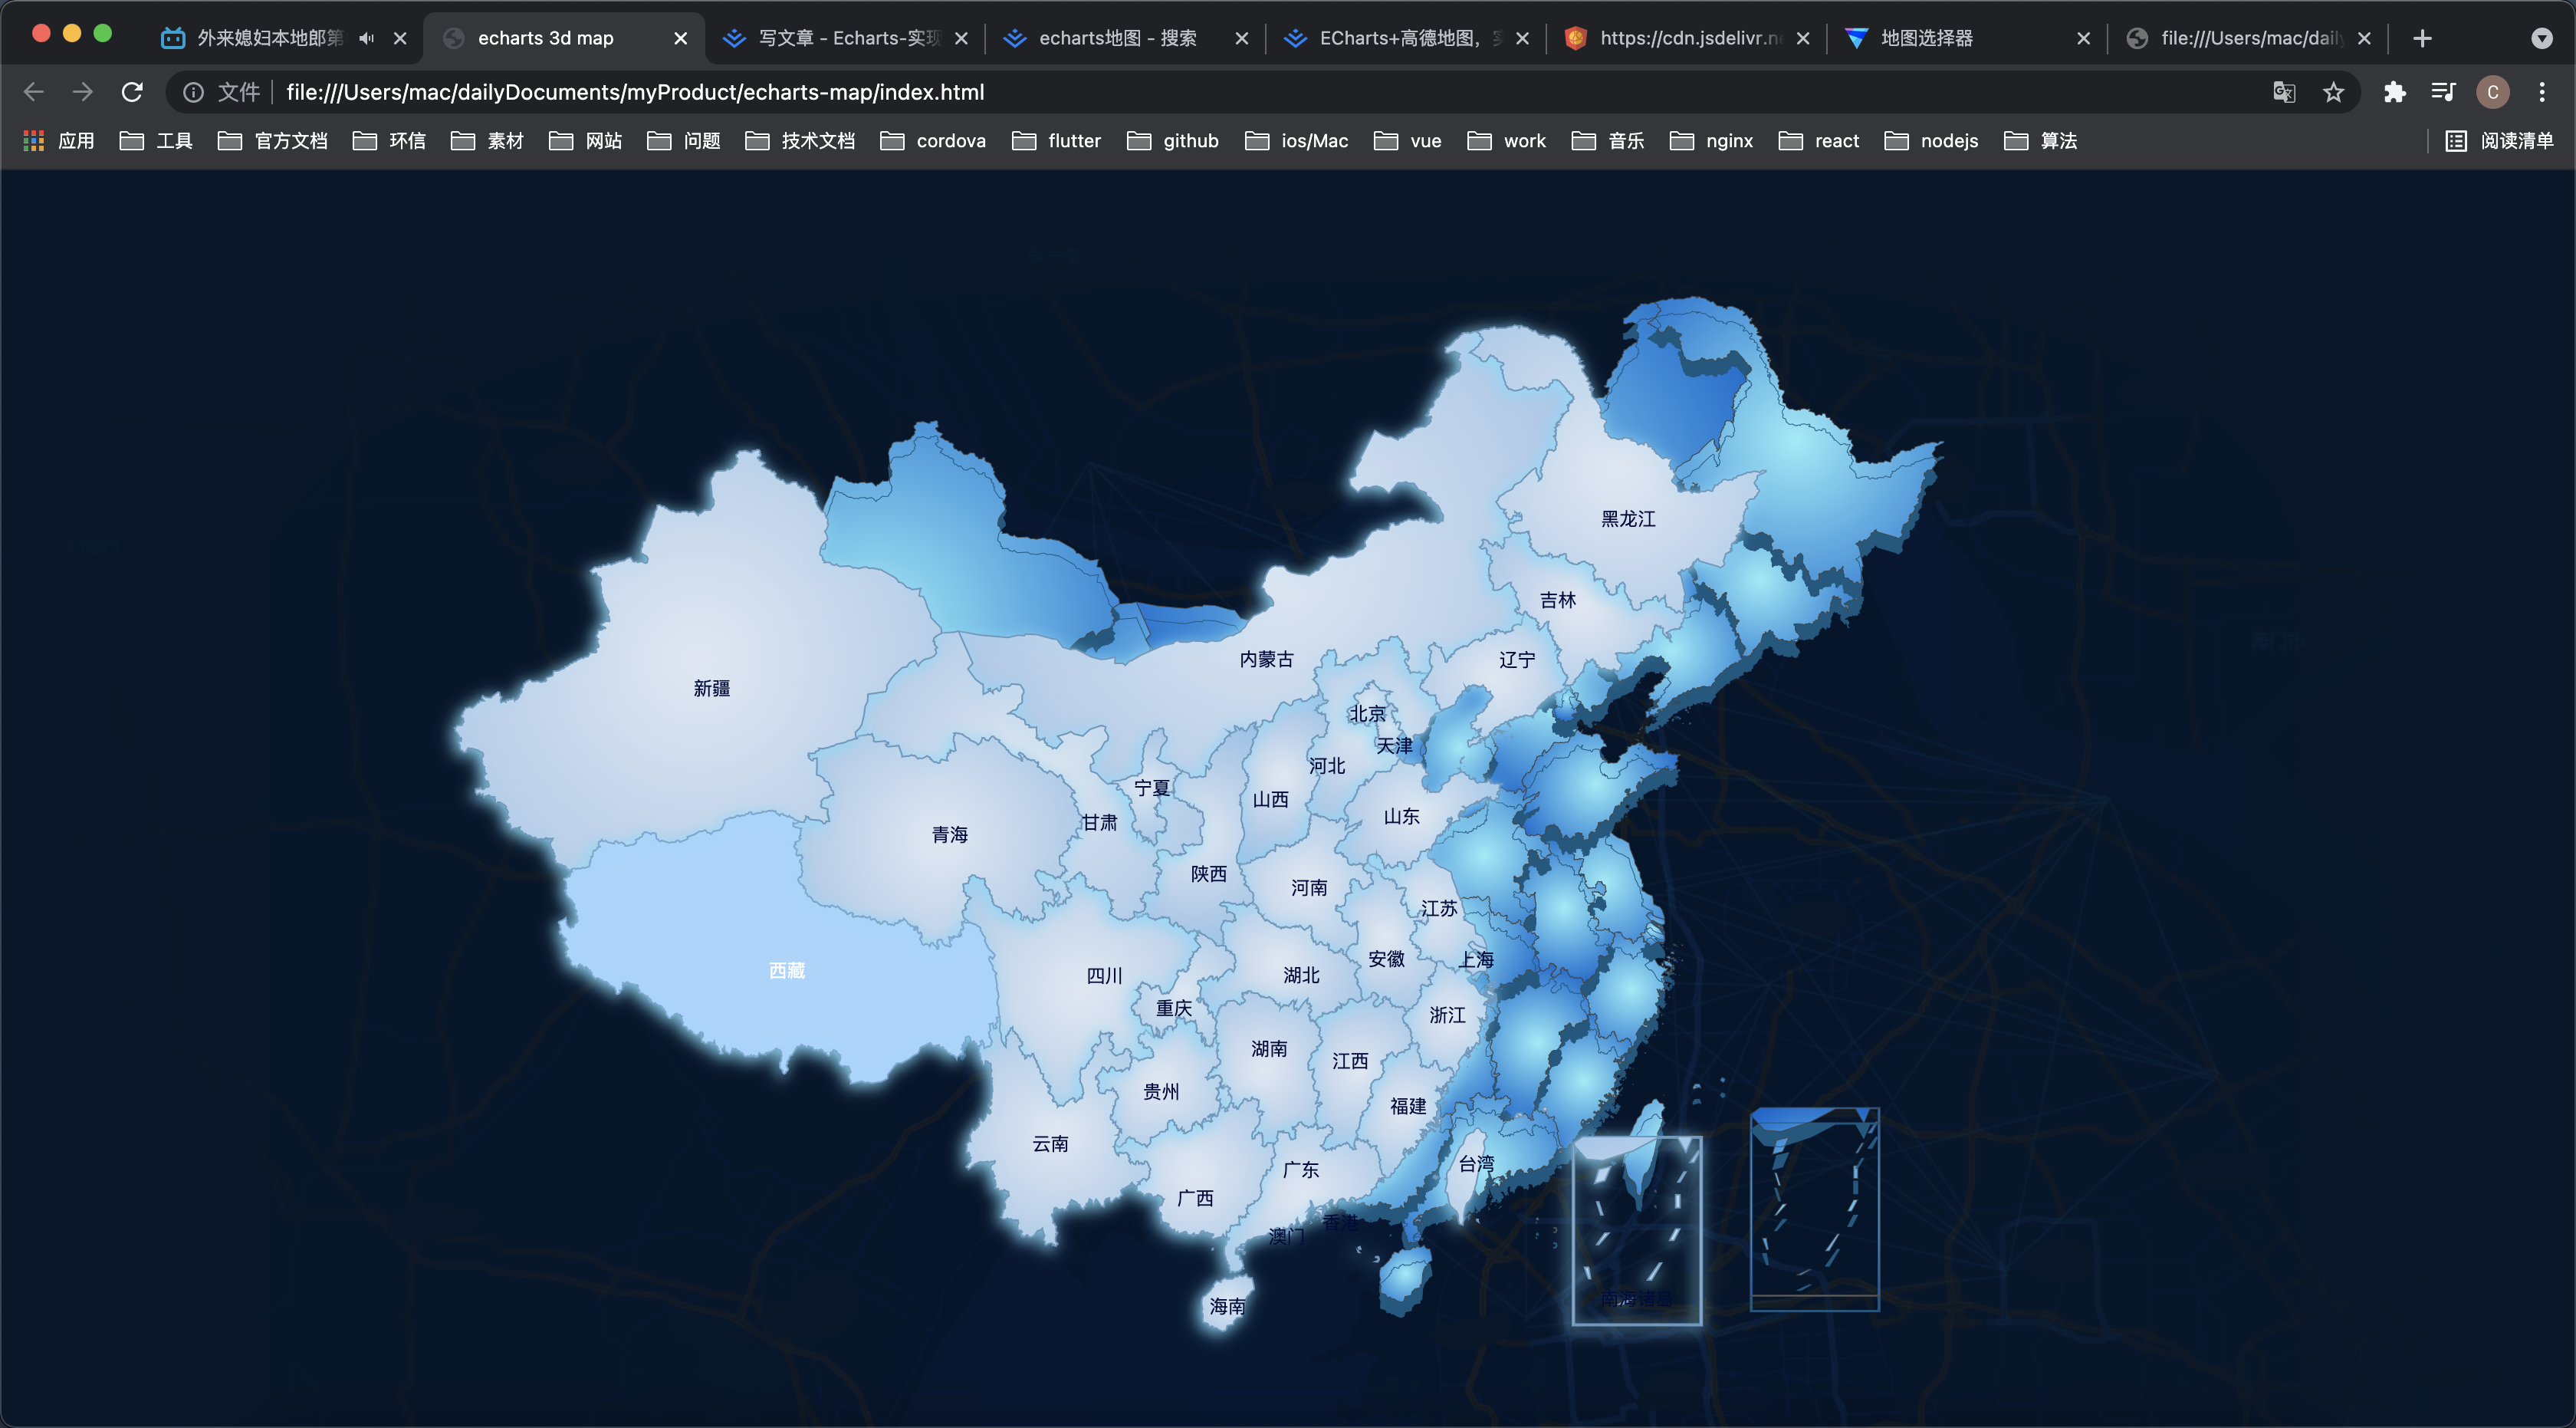
可以看到现在已经有一个类似3d的阴影效果
5. 实现下钻效果
mapEcharts.on("click", (params) => {
    // 当双击事件发生时,清除单击事件,仅响应双击事件
    clearTimeout(timeFn);
    timeFn = setTimeout(function () {
    if (
      allAreaCode.filter((item) => item.name.indexOf(params.name) > -1)[0]
    ) {
      let areaCode = allAreaCode.filter(
        (item) => item.name.indexOf(params.name) > -1
      )[0].code;
      loadMap(
        `https://geo.datav.aliyun.com/areas_v3/bound/${areaCode}_full.json`
      )
        .then((data) => {
          initMap(data, areaCode);
        })
        .catch(() => {
          loadMap(
            `https://geo.datav.aliyun.com/areas_v3/bound/${areaCode}.json`
          )
            .then((res) => {
              initMap(res, areaCode);
            })
            .catch(() => {});
        });

      historyList.push({
        code: areaCode,
        name: params.name,
      });

      let result = [];
      let obj = {};
      for (let i = 0; i < historyList.length; i++) {
        if (!obj[historyList[i].code]) {
          result.push(historyList[i]);
          obj[historyList[i].code] = true;
        }
      }
      historyList = result;
    }
    }, 250);
});
这里的loadMap为数据请求封装,initMap为渲染地图,后面在全部代码中会放出来。
这里主要逻辑是监听地图点击事件,通过筛选的到areaCode,通过areaCode拼接路径请求数据,这里的地址能在上面网站获取,之所以分_full和普通的是因为,地图数据有可能包含子区域数据,例如广东省内包含广州市、佛上市等…
allAreaCode是我花很多时间搜集全国地区省市区code数据,这份数据可能有部分错误,懂爬虫的大佬可以直接爬上面网站的数据,处理成我的数据格式就行
地图渲染后把历史记录推进historyList中,后面钻出用到。
5. 实现钻出效果
mapEcharts.on("dblclick", (params) => {
    // 当双击事件发生时,清除单击事件,仅响应双击事件
    clearTimeout(timeFn);
    if (historyList.length == 1) {
        alert("已经到达最上一级地图了");
        return;
    }
    let map = historyList.pop();
    if (historyList[historyList.length - 1].code == "china") {
        initMap(china, "china", "中国");
    } else {
        loadMap(
          `https://geo.datav.aliyun.com/areas_v3/bound/${
            historyList[historyList.length - 1].code
          }_full.json`
        ).then((data) => {
            initMap(data, historyList[historyList.length - 1].code);
        }).catch(() => {
        loadMap(
          `https://geo.datav.aliyun.com/areas_v3/bound/${
            historyList[historyList.length - 1].code
          }.json`
        )
          .then((res) => {
            initMap(res, historyList[historyList.length - 1].code);
          })
          .catch(() => {});
      });
    }
});
这里采用双击钻出方式,双击时从历史记录中删除最后一个,并且取删除后数组的最后一个元素数据来渲染地图
6. 同步map层与geo层的鼠标事件
如果开启鼠标事件,会发现无论scale或者move,map层和geo层都是分开的,例如:
这种情况我们可以通过事件监听来同步他们的数据
mapEcharts.on("georoam", (params) => {
  let option = mapEcharts.getOption(); //获得option对象
  if (params.zoom != null && params.zoom != undefined) {
    //捕捉到缩放时
    option.geo[0].zoom = option.series[0].zoom; //下层geo的缩放等级跟着上层的geo一起改变
    option.geo[0].center = option.series[0].center; //下层的geo的中心位置随着上层geo一起改变
  } else {
    //捕捉到拖曳时
    option.geo[0].center = option.series[0].center; //下层的geo的中心位置随着上层geo一起改变
  }
  mapEcharts.setOption(option); //设置option
});
7. 最终代码与效果
<!DOCTYPE html>
<html lang="en">
  <head>
    <meta charset="UTF-8" />
    <meta http-equiv="X-UA-Compatible" content="IE=edge" />
    <meta name="viewport" content="width=device-width, initial-scale=1.0" />
    <title>echarts 3d map</title>
    <style>
      * {
        margin: 0;
        padding: 0;
      }

      .echarts-map {
        position: fixed;
        top: 0;
        left: 0;
        width: 100vw;
        height: 100vh;
        background: url("./background.png") no-repeat;
      }
    </style>
  </head>

  <body>
    <div class="echarts-map" id="3dMap"></div>
  </body>
  <script src="https://cdn.bootcdn.net/ajax/libs/jquery/3.6.0/jquery.min.js"></script>
  <script src="https://cdn.bootcdn.net/ajax/libs/echarts/5.1.2/echarts.min.js"></script>
  <script src="./china.js"></script>
  <script src="./geoAtlasJson.js"></script>
  <script>
    let mapEcharts = null;
    let historyList = [];
    let timeFn = null;

    if (mapEcharts) {
      mapEcharts.dispose(); // 销毁实例,实例销毁后无法再被使用。
    }
    // 初始化图表
    mapEcharts = echarts.init(document.getElementById("3dMap"));

    historyList.push({
      code: "china",
      name: "中国",
    });

    // 加载效果
    mapEcharts.showLoading();

    initMap(china, "china", "中国");

    mapEcharts.on("click", (params) => {
      // 当双击事件发生时,清除单击事件,仅响应双击事件
      clearTimeout(timeFn);
      timeFn = setTimeout(function () {
        if (
          allAreaCode.filter((item) => item.name.indexOf(params.name) > -1)[0]
        ) {
          let areaCode = allAreaCode.filter(
            (item) => item.name.indexOf(params.name) > -1
          )[0].code;
          loadMap(
            `https://geo.datav.aliyun.com/areas_v3/bound/${areaCode}_full.json`
          )
            .then((data) => {
              initMap(data, areaCode);
            })
            .catch(() => {
              loadMap(
                `https://geo.datav.aliyun.com/areas_v3/bound/${areaCode}.json`
              )
                .then((res) => {
                  initMap(res, areaCode);
                })
                .catch(() => {});
            });

          historyList.push({
            code: areaCode,
            name: params.name,
          });

          let result = [];
          let obj = {};
          for (let i = 0; i < historyList.length; i++) {
            if (!obj[historyList[i].code]) {
              result.push(historyList[i]);
              obj[historyList[i].code] = true;
            }
          }
          historyList = result;
        }
      }, 250);
    });

    mapEcharts.on("dblclick", (params) => {
      // 当双击事件发生时,清除单击事件,仅响应双击事件
      clearTimeout(timeFn);
      if (historyList.length == 1) {
        alert("已经到达最上一级地图了");
        return;
      }
      let map = historyList.pop();
      console.log(historyList[historyList.length - 1])
      if (historyList[historyList.length - 1].code == "china") {
        initMap(china, "china", "中国");
      } else {
        loadMap(
          `https://geo.datav.aliyun.com/areas_v3/bound/${
            historyList[historyList.length - 1].code
          }_full.json`
        )
          .then((data) => {
            initMap(data, historyList[historyList.length - 1].code);
          })
          .catch(() => {
            loadMap(
              `https://geo.datav.aliyun.com/areas_v3/bound/${
                historyList[historyList.length - 1].code
              }.json`
            )
              .then((res) => {
                initMap(res, historyList[historyList.length - 1].code);
              })
              .catch(() => {});
          });
      }
    });

    mapEcharts.on("georoam", (params) => {
      let option = mapEcharts.getOption(); //获得option对象
      if (params.zoom != null && params.zoom != undefined) {
        //捕捉到缩放时
        option.geo[0].zoom = option.series[0].zoom; //下层geo的缩放等级跟着上层的geo一起改变
        option.geo[0].center = option.series[0].center; //下层的geo的中心位置随着上层geo一起改变
      } else {
        //捕捉到拖曳时
        option.geo[0].center = option.series[0].center; //下层的geo的中心位置随着上层geo一起改变
      }
      mapEcharts.setOption(option); //设置option
    });

    // 地图数据请求
    async function loadMap(url, pathName) {
      return await $.getJSON(url);
    }

    // 地图初始化
    function initMap(mapData, mapName) {
      // 注册地图
      echarts.registerMap(mapName, mapData);

      // 配置项
      let options = {
        geo: {
          map: mapName, //地图类型。
          zoom: 1,
          roam: true,
          animation: false,
          itemStyle: {
            // 区域样式
            areaColor: {
              type: "radial",
              x: 0.5,
              y: 0.5,
              r: 0.8,
              colorStops: [
                {
                  offset: 0,
                  color: "rgba(147, 235, 248, 1)", // 0% 处的颜色
                },
                {
                  offset: 1,
                  color: "rgba(2, 99, 206, 1)", // 100% 处的颜色
                },
              ],
              globalCoord: false, // 缺省为 false
            },
            shadowColor: "#105781", //地图区域的阴影颜色。
            shadowOffsetX: 0,
            shadowOffsetY: 10,
          },
        },
        series: [
          {
            name: "map",
            type: "map", // 地图
            map: mapName, // 加载注册的地图
            selectedMode: false, // 不让单独选中
            roam: true, // 开始鼠标事件,scale缩放、move移动
            // 图形上的文本标签
            label: {
              show: true,
              color: "#000a3c",
            },
            // 地图样式
            itemStyle: {
              // 区域样式
              areaColor: {
                type: "radial",
                x: 0.5,
                y: 0.5,
                r: 3,
                colorStops: [
                  {
                    offset: 0,
                    color: "rgba(223, 231, 242, 1)", // 0% 处的颜色
                  },
                  {
                    offset: 1,
                    color: "rgba(2, 99, 206, 1)", // 100% 处的颜色
                  },
                ],
                globalCoord: false, // 缺省为 false
              },
              borderWidth: 1, // 边框大小
              borderColor: "rgba(104, 152, 190, 1)", // 边框样式
              shadowColor: "rgba(128, 217, 248, 1)", // 阴影颜色
              shadowOffsetX: -2, // 阴影水平方向上的偏移距离
              shadowOffsetY: 2, // 阴影垂直方向上的偏移距离
              shadowBlur: 10, // 文字块的背景阴影长度
            },
            // 选中状态下样式
            emphasis: {
              label: {
                color: "#ffffff",
              },
              itemStyle: {
                areaColor: "#a5d4fe",
              },
            },
          },
        ],
      };
      mapEcharts.setOption(options); // 实例配置项与数据

      // 隐藏loading
      mapEcharts.hideLoading();
    }
  </script>
</html>
demo github地址:https://github.com/ljnMeow/echarts-map

8. 最后的话
在制作这份demo时其实是花了挺多时间的,最开始是想通过echarts-gl直接实现一个3d地图,但通过官方文档来看echarts-gl的map3d好像不支持渐变背景,所以就直接放弃了,其次就是搜集省市区所有数据花费的时间,不得不感叹我们大华夏是真的地大物博。
最后希望这份教程对各位有帮助,觉得ok的话麻烦留个赞👍,或者github给点star🌟也行🙏。
祝各位大佬步步高升🧨